Google Tables

Views
Google Tables will show all rows and all columns by default and begins with a starting view named “Saved View 1”.
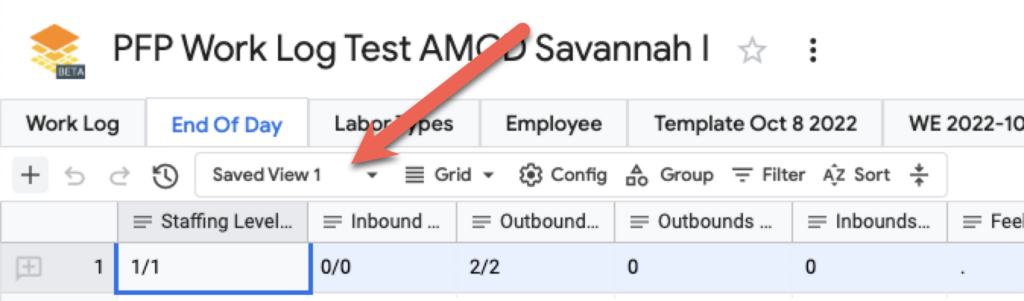
You can create new views that store various filters, groups, summary rows, and other customizations that affect how data is displayed.
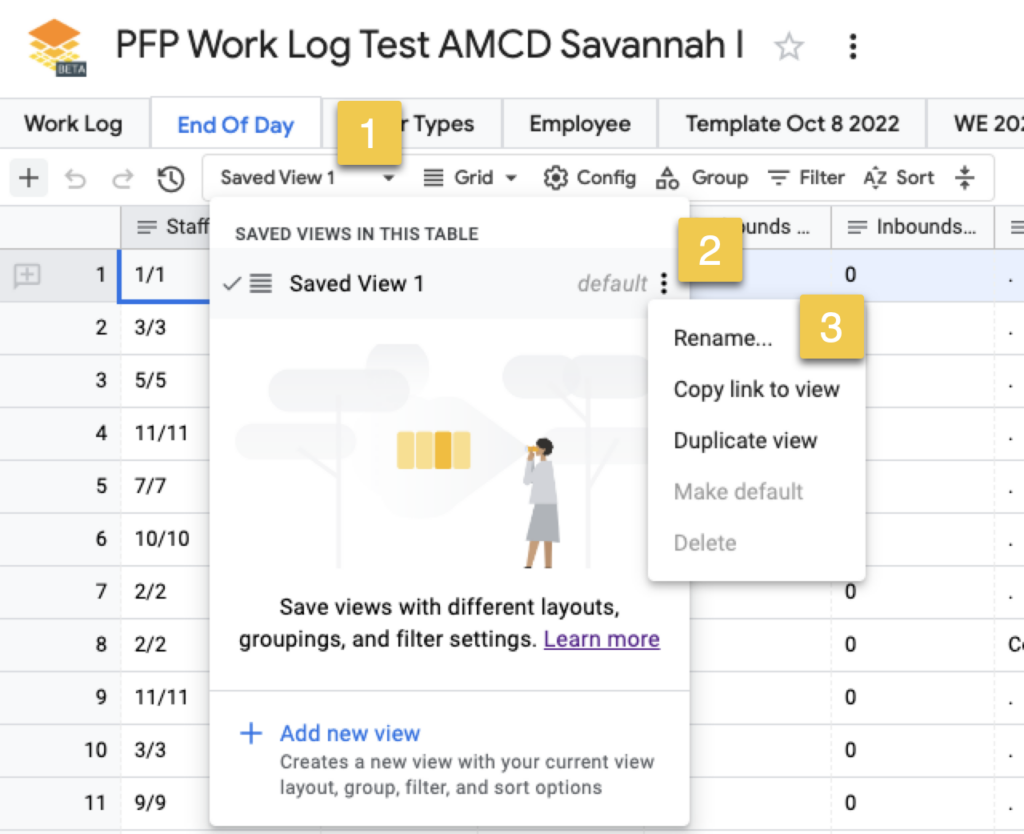
Renaming The Default View
I’ve renamed the default view to “Full Log”.
- Click on the view drop down
- Click on the “3 Dot” menu next to the view named “Saved View 1”
- Select Rename
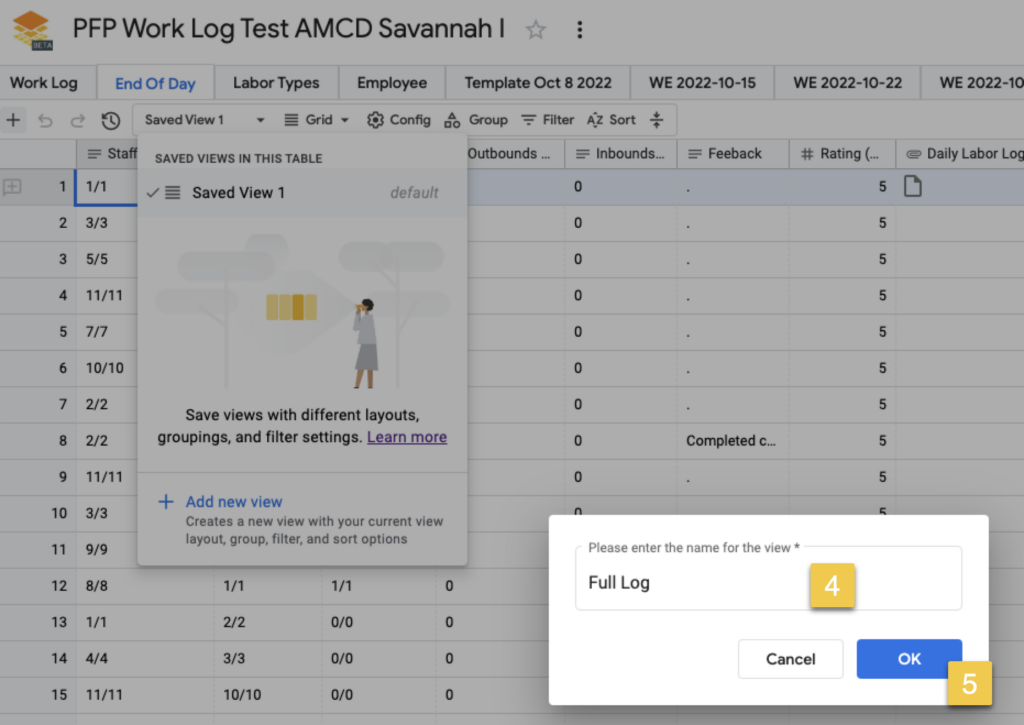
- Type in the new name “Full Log”
- Click OK to save
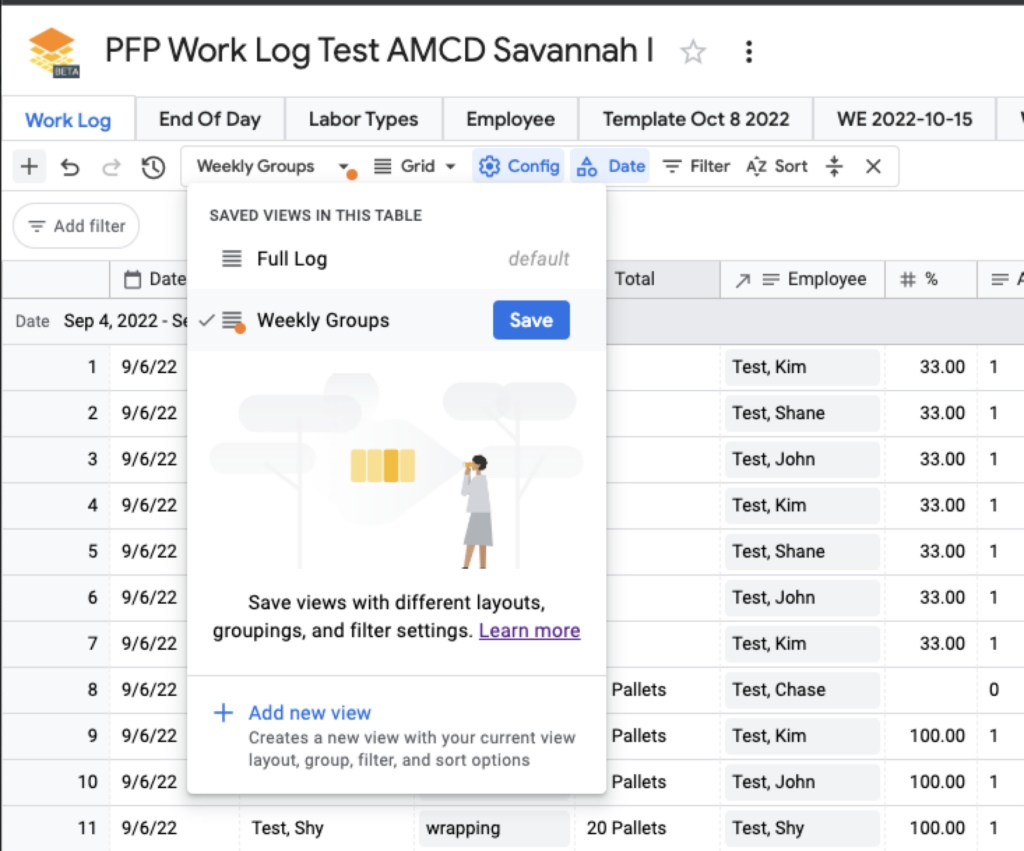
Adding A View
After grouping the work log by week (see Group By Date below), saving this as a new view is a smart choice.
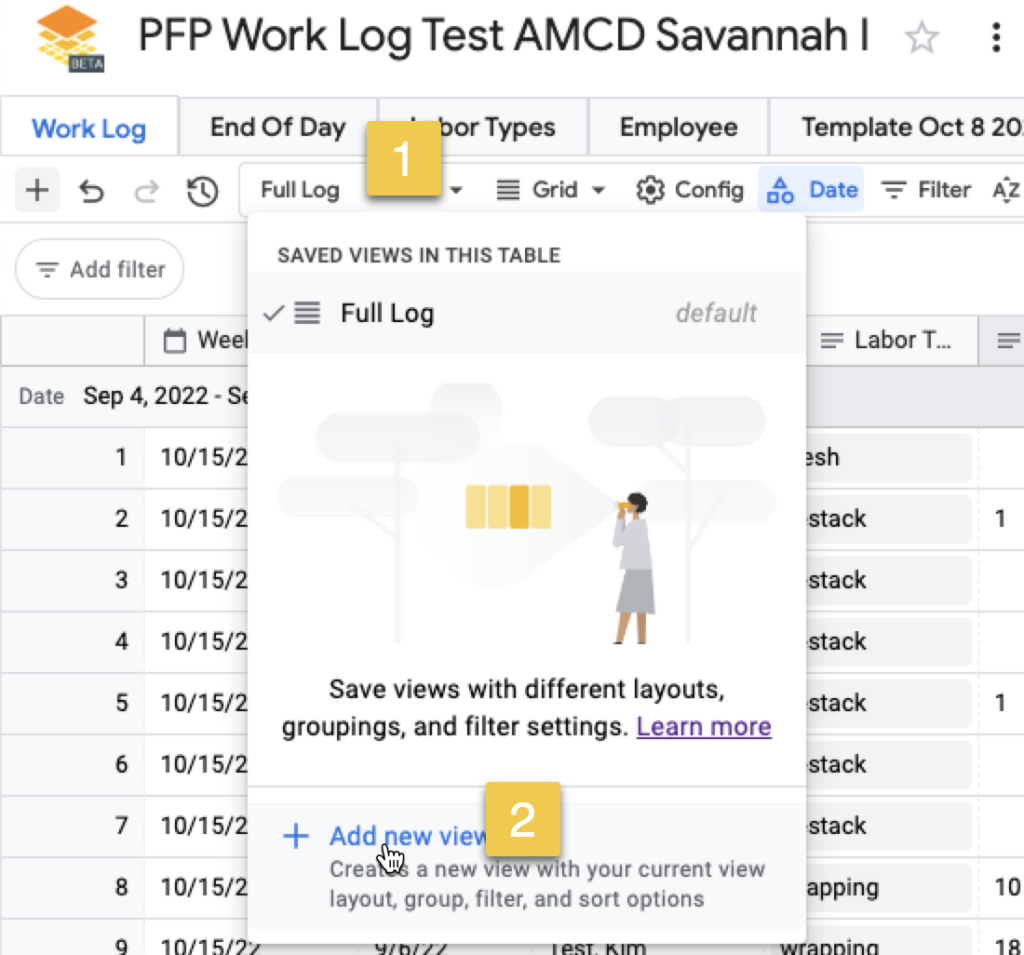
Set the new name to “Weekly Groups” when prompted.
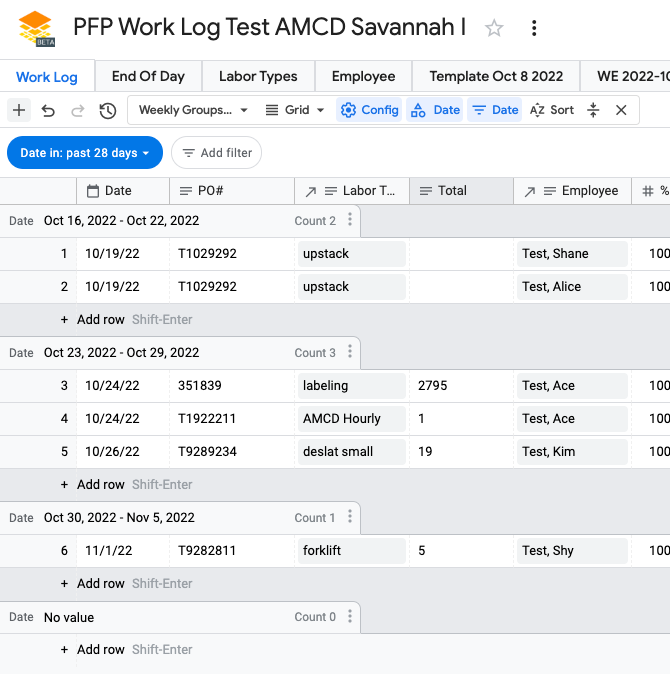
Add your groups, filters, and other view modifications. Here I grouped by the Date column with a “By Week” option. I also chose not to display the “Week Ending” column, dropping it via the filters.
When things are the way you want them to look, go back to the view menu and click Save to save the current view to your saved view named “Weekly Groups”.
Group By Date
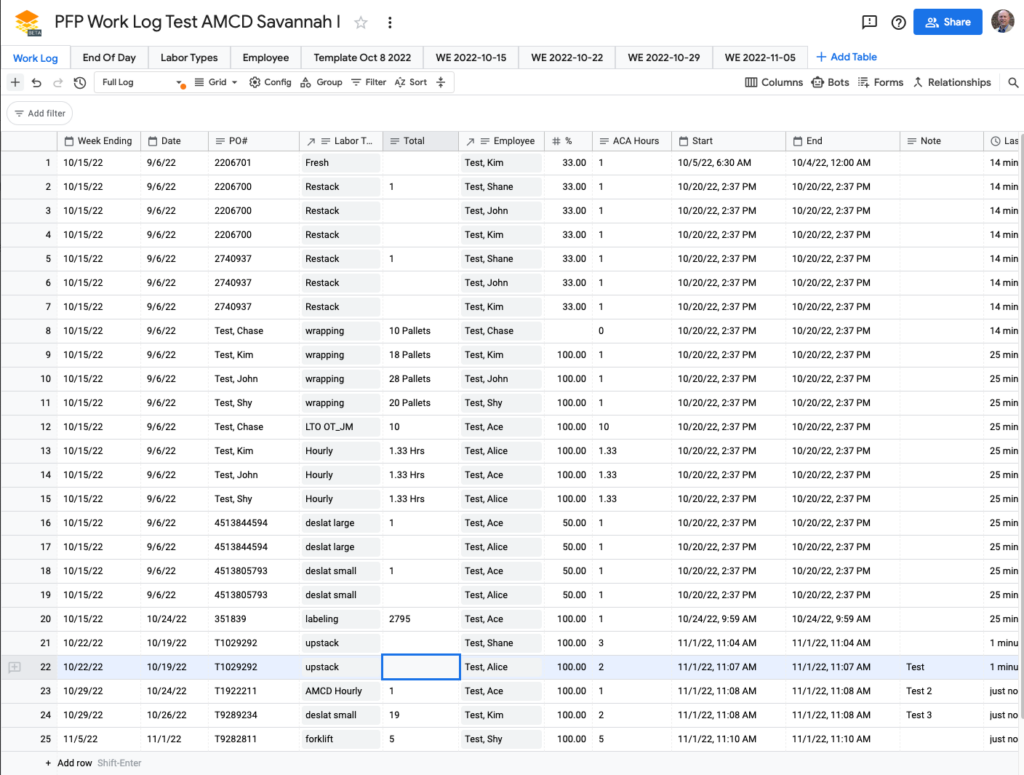
The daily work logs are a great example of how the date grouping feature works.
In this example a single work log has been created to contain ALL of the entries from the work site. A running log of “all entries for every week” versus separate sheets for each week.
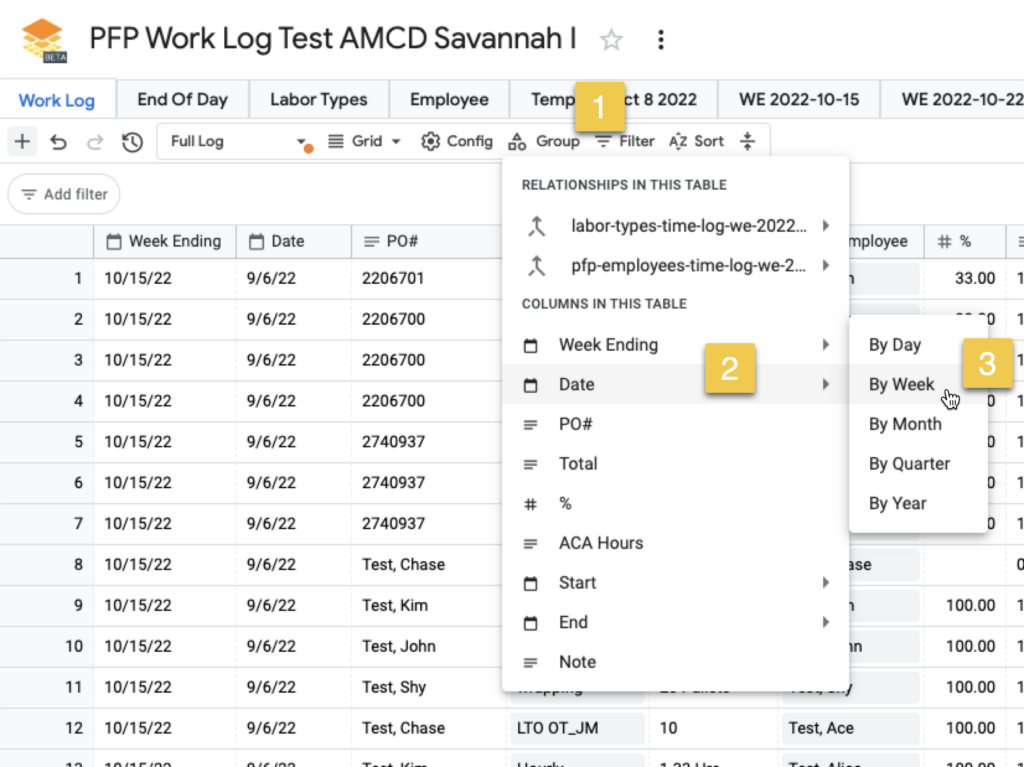
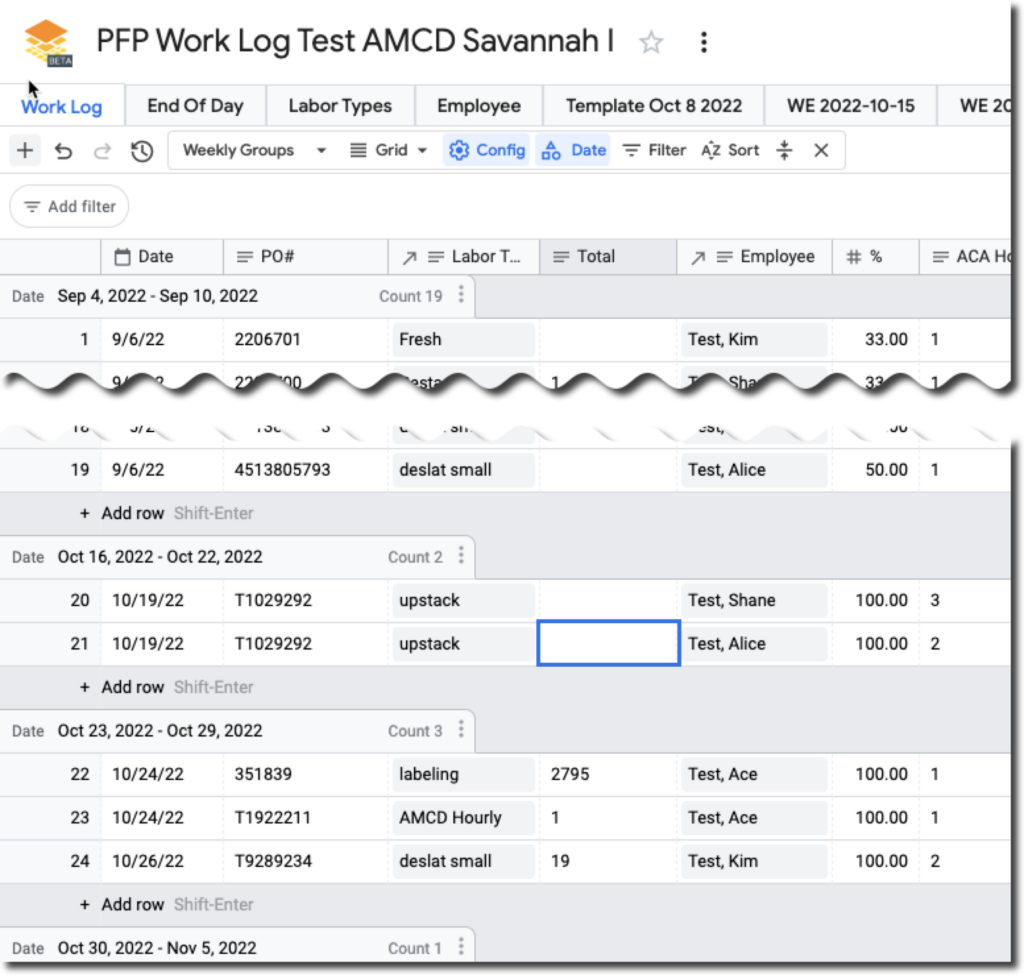
Weekly Grouping
As luck would have it, Google Tables “By Week” groups by a proper calendar week starting Sunday and running through Saturday. Perfect for the PFP Logistics standard of reporting on “Week Ending” dates that end on a Saturday.
- Click Group in the table toolbar
- Select the Date column from the example work log.
- Choose By Week
Notes
- One potential downside — gTables does not appear to have a way to change the ORDER of the weekly grouping. The oldest group is at the top, which means 52+ sections to scroll down through in a year.
- Since there also does not seem to be a “collapse” or “panel” option it means potentially a lot of rows.
- One workaround may be to set filters and views, like “filter to only dates > October 29th 2022” to limit how many groups appear while working on the sheet.
“How many times has this <Labor Type> been used?”
This is a cool trick for any of the “Lookup Lists” we create. For example, our workspaces all have a Labor Type lookup table.
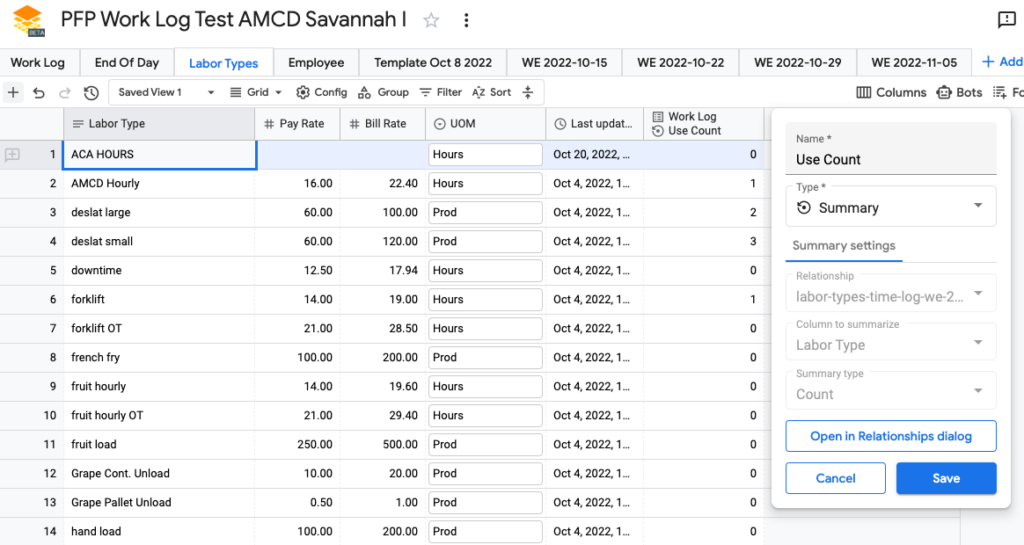
It turns out that if we use a single “aggregate” work log table we can easily count up all the times a specific labor type has been used and show it right on the labor types table.
This is called a “Lookup Summary” column.
Here is a “Summary Count of Labor Types” showing how many times each labor type was referenced on the aggregate work log.
Setting It Up
First step was to put all work log entries into a single sheet (Side note: this may be easier than adding/copying weekly tables — need to investigate) so we can get one summary count. Without that we would only have a column that counted a specific week (i.e. Use Count for the WE 2022-10-15 table).
Next…
- Add a column
- Type = Link To Table
- Subtype = Summary
- Choose the table to get the summary on (“Work Log” = the aggregate “all weeks” log I setup)
- Choose the column to summarize, here is it the Labor Type column as I want to count all uses.
- Summary Type is “Count”
Generating Docs With Scripts
While there is not a lot of support for gathering information from multiple tables into a single view from with Google Tables itself, the availability of App Scripts opens the door to other options. One option is a document generator that can auto-create Google Documents or Google Slides from a template that gets filled with data from one (or more) tables.
The Google Tables intro to App Scripts generating documents from templates can be found here.
That trick will leverage the Google Tables API from within the App Script, these Tables API help pages can be useful for that.
Using Views for Data Analysis
This video shows a brief intro into some of the built-in data summary and grouping tools built into Google Tables. This can provide additional insight into performance and allow PFP to start gathering intelligence at an oversight level.
This video shows how to get a view of tasks logged each week along with a summary of ACA Hours, unique POs billed, etc. It also shows how to get a report of total employee hours worked in the past (trailing) 7 day period.
Sending Emails When Checking A Box (Start of Day / End of Day Summary)
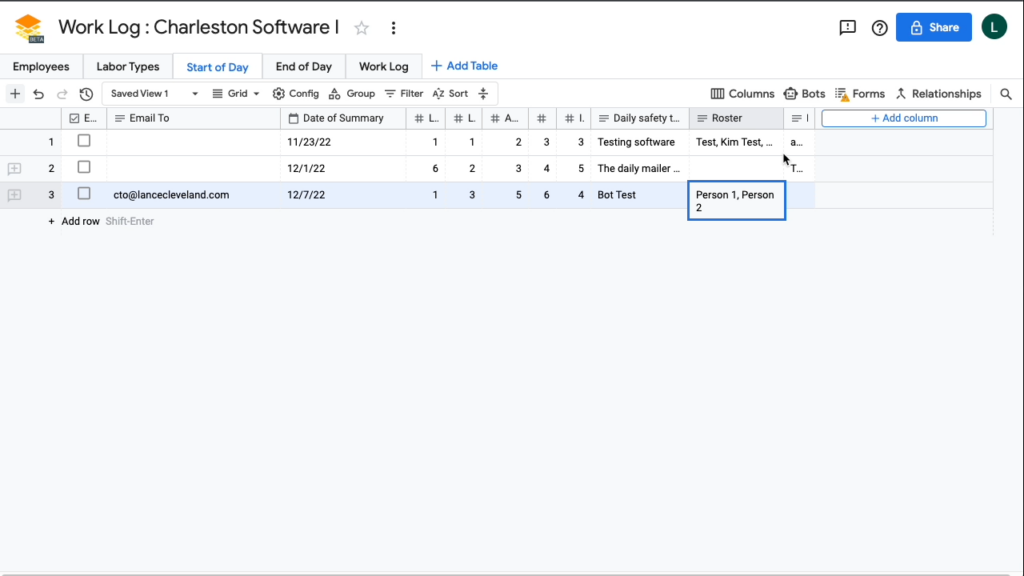
Assuming the table already has data you want to send you can add a couple of additional columns to help with sending an email summarizing a single row of data.
- Add a checkbox column “Email Sent”
- Set the default to unchecked
- Add a text column “Email To”
- Set the default to the email address the bot will normally send to
- Note: the default is applied when adding new rows only
- You can add multiple email addresses by separating them with a comma
- The “Email To” column can be overridden before sending an email to change the recipient list
- Set the default to the email address the bot will normally send to
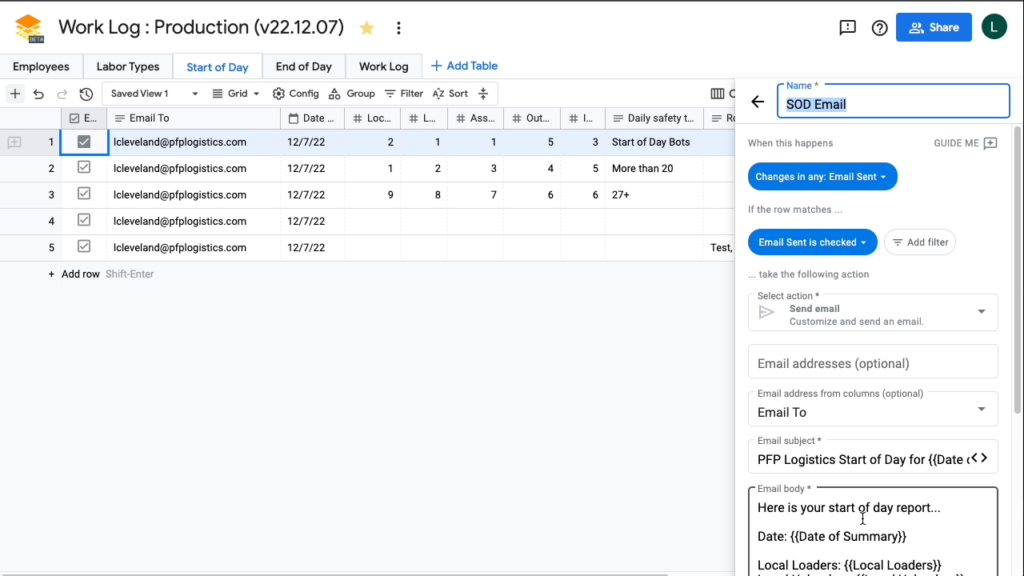
- Click on “Bots” on the top-right button bar
- Click New Bot
- Give the bot a name “SOD Email” for example
- Set “When this happens” to “column value changes” with the column “Email Sent”
- Set “If the row matches” to “column Email Sent is checked”
- Set “Select action” to “Send Email”
- Set “Email address from columns” to the “Email To” column
- Set the “Email subject” to the desired email subject
- Set the “Email body” to the content of the email using plain text and using {{<field name>}} to insert data from the row that is processed when the checkbox is checked. Click the <> icon to have Google Tables help with field names.
0:22 / 4:55
How To Send Email From Google Tables Using A Bot 2022-12-07_15-46-11